
Naloxone Distribution Interactive Map
This map can be used to assist individuals in finding free naloxone closest to them.
Learn More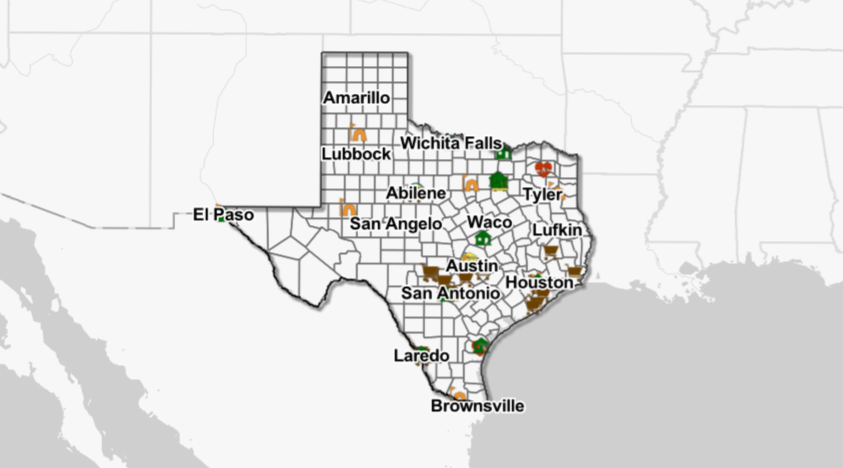
Maternal Health Dashboards
These interactive dashboards provide an overview of maternal health in Texas and are a resource for all Texans. These data supports decision making to improve the health of Texas mothers and babies.
 Maternal Health
The Maternal Health dashboard provides Texas data on maternal health topics, including maternal mortality, pregnancy planning, maternal mental health, and physical health factors.
 Texas AIM
The TexasAIM Quality Improvement Analysis and Outcomes Dashboard provides data on TexasAIM patient safety bundle implementation and outcomes.
 Severe Maternal Morbidity
The Severe Maternal Morbidity Dashboard provides Texas data on Severe Maternal Morbidity overall, by indicator, and by select demographics.
 Maternal Mortality and Morbidity Review Committee (MMMRC)
The Maternal Mortality and Morbidity Review Committee (MMMRC) dashboard provides an overview of how the committee reviews pregnancy-associated death cases during each quarterly meeting.
Maternal Health Dashboards
These interactive dashboards provide an overview of maternal health in Texas and are a resource for all Texans. These data supports decision making to improve the health of Texas mothers and babies.
Infant Health Dashboards
These interactive dashboards provide an overview of infant health in Texas and are a resource for all Texans. These data supports decision making to improve the health of Texas mothers and babies.
 Infant Mortality and Morbidity
The Infant Mortality and Morbidity dashboard provides Texas data on infant mortality, the leading causes of infant death, preterm birth, and low birthweight.
 Infant Health Practices
This dashboard provides Texas data on infant health topics including breastfeeding and safe infant sleep.
 Congenital Syphilis
This interactive dashboard provides an overview of congenital syphilis (CS) surveillance in Texas. The data suppprts decision making to support CS prevention, program planning, and policy development.
 Birth Demographics
This dashboard provides data on Texas live births including birth rate, teen birth rate, and select demographics.
Infant Health Dashboards
These interactive dashboards provide an overview of infant health in Texas and are a resource for all Texans. These data supports decision making to improve the health of Texas mothers and babies.
Texas Respiratory Illness Interactive Dashboard
This interactive respiratory illness dashboard provides a resource for all Texans, including healthcare providers, local leaders, and public health jurisdictions to monitor respiratory illness trends.

Texas Respiratory Illness Interactive Dashboard
This interactive respiratory illness dashboard provides a resource for all Texans, including healthcare providers, local leaders, and public health jurisdictions to monitor respiratory illness trends.
Naloxone Distribution Interactive Map
Naloxone and other research-backed, community-based interventions can save lives during drug poisonings. Naloxone may reverse opioid effects in a drug poisoning. This map shows where to get naloxone near you. All sites shown offer free naloxone to anyone who meets the eligibility listed for each site.
Emergency Medical Services Trauma Registries
This dashboard provides Texas data on EMS responses to non-fatal drug poisonings. It includes numbers and rates of drug poisonings over time, average EMS response time, and percent of patients receiving naloxone. Data can be viewed for all drugs, opioids, and stimulants.
© Copyright 2018-2025. Texas Health & Human Services Commission. All rights reserved.